Compute siting class for a station measuring air temperature
Source:R/compute_class_air_temperature.R
compute_class_air_temperature.RdAssess the class of a station from the type of surrounding land cover, slope, vegetation and shadowing as potential heat sources affecting sensors and using the requirements set by WMO and Met
Usage
compute_class_air_temperature(
  stn = NULL,
  land = NULL,
  horizon = NULL,
  dem = NULL,
  test_type = "MET",
  f_plot = TRUE
)
Arguments
- stn
A SpatVector with station attributes from
"get_latlon_frost"- land
A data.frame with land type distribution from
"compute_landtype_distance"- horizon
A data.frame with horizon distribution from
"compute_horizon_max"- dem
A SpatRaster terrain model
- test_type
A string defining a type of tests to apply: "WMO" or "Met"
- f_plot
A boolean whether to plot figures
Examples
# Get station metadata
stn <- get_metadata_frost(stationid = 18700, dx = 100, resx = 1)
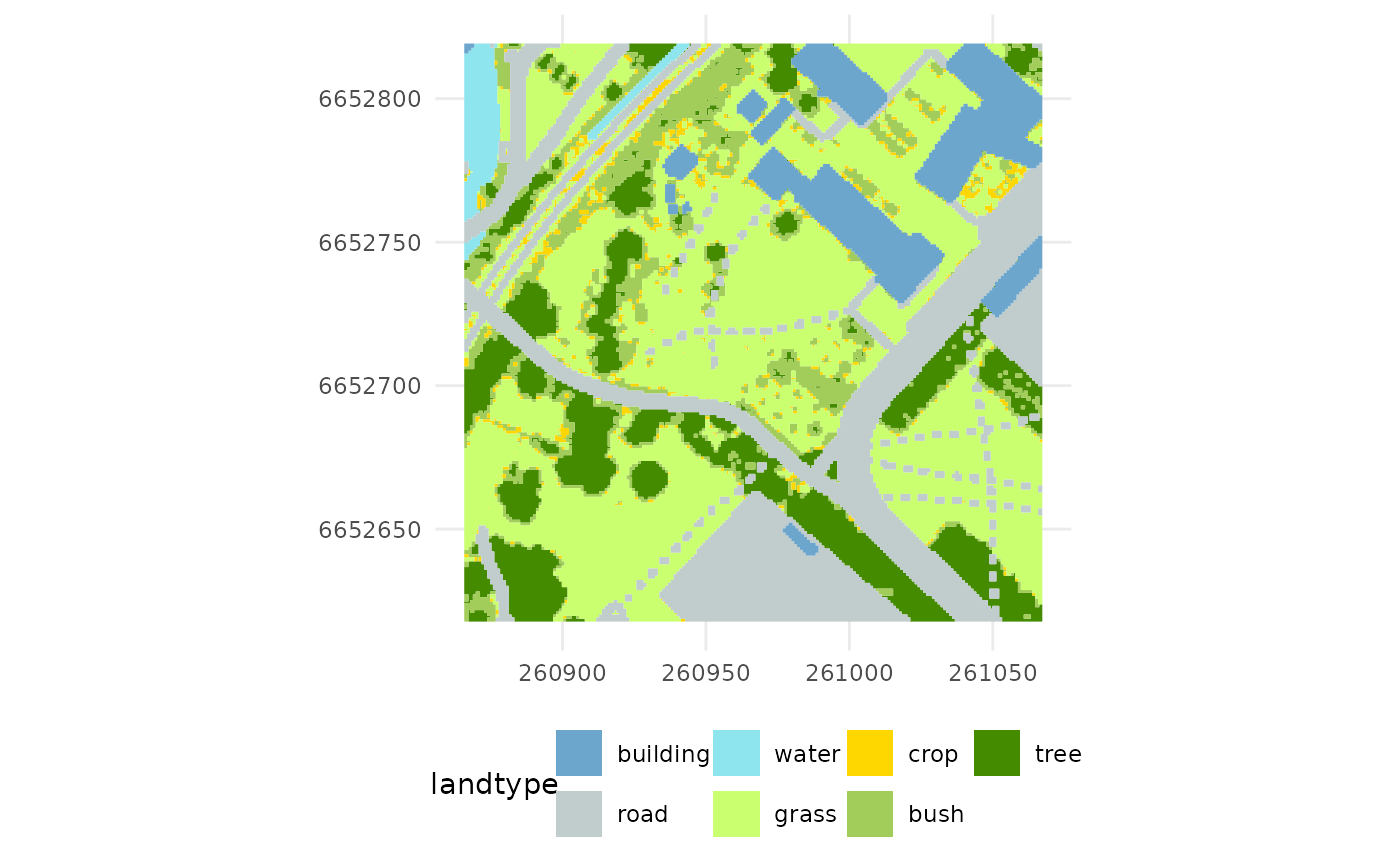
# Compute land type
landtype <- compute_landtype(stn, f_plot = TRUE)
#> [1] "Process: 18700 - 260966.8/6652718.0 - dtm - 100/1 - path: data/dem"
#> [1] "Load demo file: data/dem/18700_dtm_25833_d00100m_1.0m.tif"
#> [1] "Process: 18700 - 260966.8/6652718.0 - dom - 100/1 - path: data/dem"
#> [1] "Load demo file: data/dem/18700_dom_25833_d00100m_1.0m.tif"
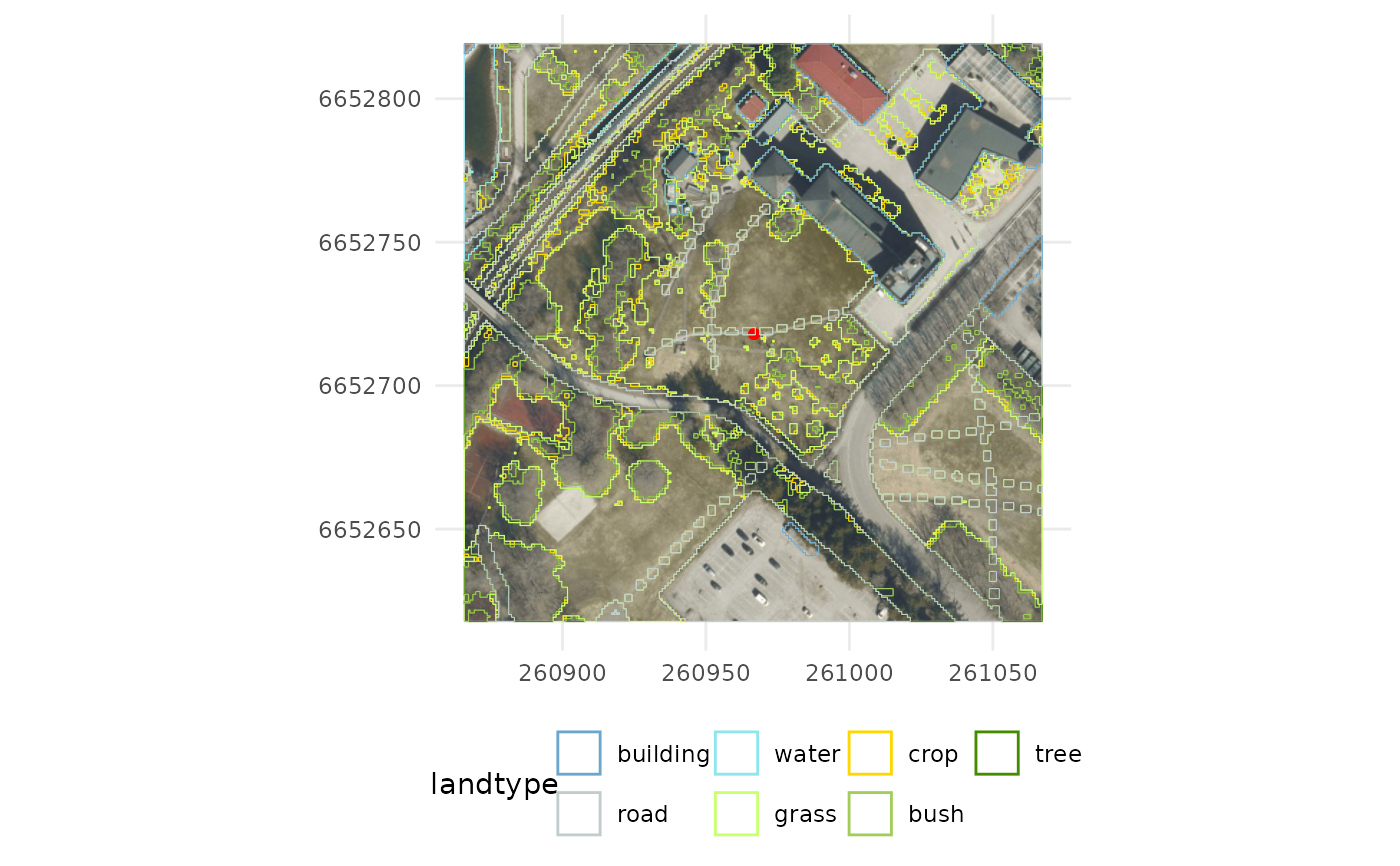
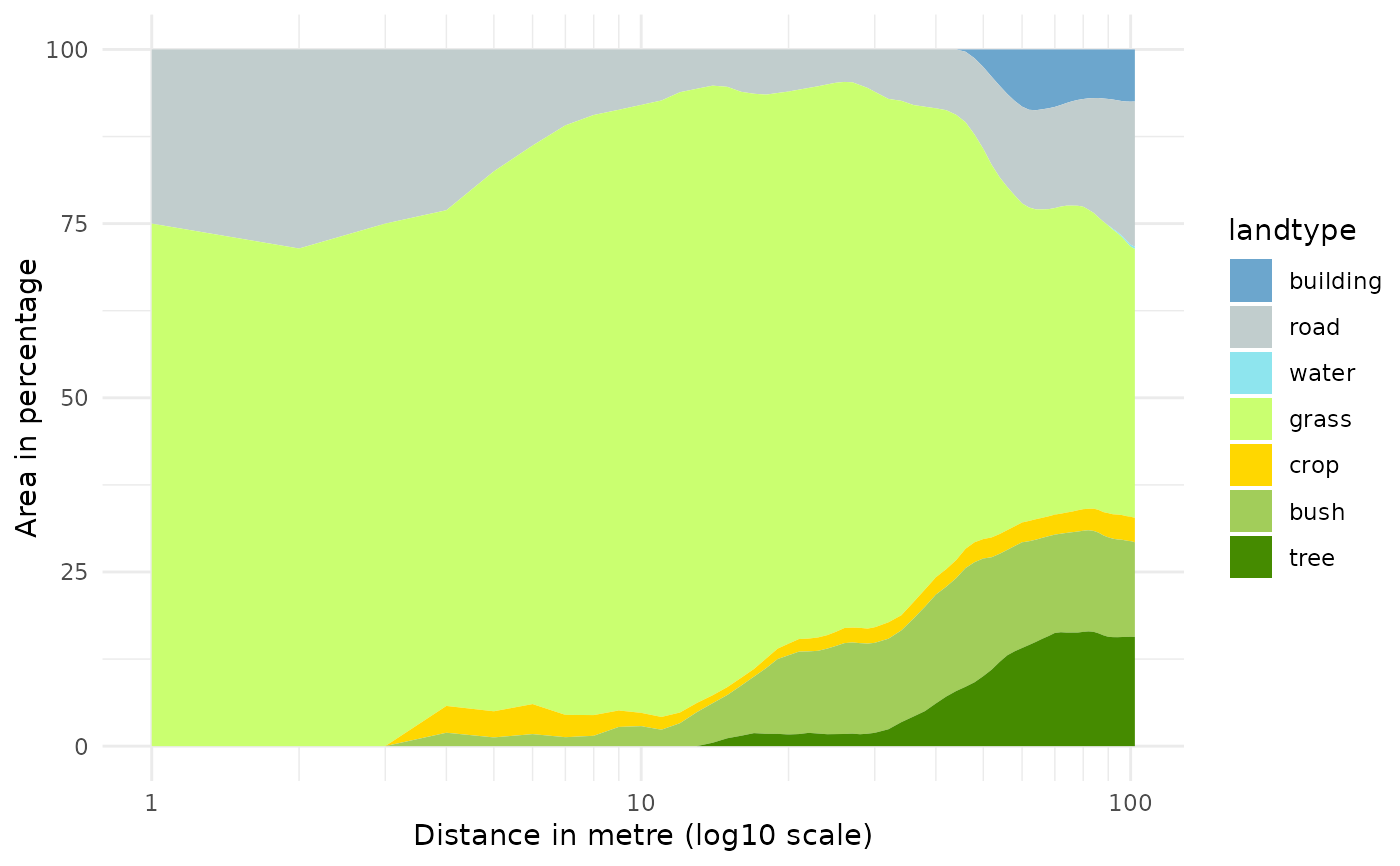
 # Compute land type distance to station
landtype_dist <- compute_landtype_distance(stn, landtype, f_plot = TRUE)
#> [1] "Process: 18700 - 260966.8/6652718.0 - dtm - 100/1 - path: data/dem"
#> [1] "Load demo file: data/dem/18700_dtm_25833_d00100m_1.0m.tif"
# Compute land type distance to station
landtype_dist <- compute_landtype_distance(stn, landtype, f_plot = TRUE)
#> [1] "Process: 18700 - 260966.8/6652718.0 - dtm - 100/1 - path: data/dem"
#> [1] "Load demo file: data/dem/18700_dtm_25833_d00100m_1.0m.tif"
 # Compute maximum horizon
horizon_max <- compute_horizon_max(stn, step = 1, f_plot_polygon = FALSE)
#> [1] "Process: 18700 - 260966.8/6652718.0 - dtm - 100/1 - path: data/dem"
#> [1] "Load demo file: data/dem/18700_dtm_25833_d00100m_1.0m.tif"
#> [1] "Process: 18700 - 260966.8/6652718.0 - dom - 100/1 - path: data/dem"
#> [1] "Load demo file: data/dem/18700_dom_25833_d00100m_1.0m.tif"
#> [1] "Process: 18700 - 260966.8/6652718.0 - dtm - 20000/20 - path: data/dem"
#> [1] "Load demo file: data/dem/18700_dtm_25833_d20000m_20.0m.tif"
#> Over-riding projection check
#> Importing raster map <elev>...
#> 0% 3% 6% 9% 12% 15% 18% 21% 24% 27% 30% 33% 36% 39% 42% 45% 48% 51% 54% 57% 60% 63% 66% 69% 72% 75% 78% 81% 84% 87% 90% 93% 96% 99% 100%
#> SpatRaster read into GRASS using r.in.gdal from memory
#> Over-riding projection check
#> Importing raster map <elev>...
#> 0% 3% 6% 9% 12% 15% 18% 21% 24% 27% 30% 33% 36% 39% 42% 45% 48% 51% 54% 57% 60% 63% 66% 69% 72% 75% 78% 81% 84% 87% 90% 93% 96% 99% 100%
#> SpatRaster read into GRASS using r.in.gdal from memory
#> Over-riding projection check
#> Importing raster map <elev>...
#> 0% 3% 6% 9% 12% 15% 18% 21% 24% 27% 30% 33% 36% 39% 42% 45% 48% 51% 54% 57% 60% 63% 66% 69% 72% 75% 78% 81% 84% 87% 90% 93% 96% 99% 100%
#> SpatRaster read into GRASS using r.in.gdal from memory
# Load a digital elevation model
dem <- download_dem_kartverket(stn, name = "dtm")
#> [1] "Process: 18700 - 260966.8/6652718.0 - dtm - 100/1 - path: data/dem"
#> [1] "Load demo file: data/dem/18700_dtm_25833_d00100m_1.0m.tif"
# Compute class
compute_class_air_temperature(stn,
landtype_dist,
horizon_max,
dem,
test_type = "WMO",
f_plot = TRUE)
# Compute maximum horizon
horizon_max <- compute_horizon_max(stn, step = 1, f_plot_polygon = FALSE)
#> [1] "Process: 18700 - 260966.8/6652718.0 - dtm - 100/1 - path: data/dem"
#> [1] "Load demo file: data/dem/18700_dtm_25833_d00100m_1.0m.tif"
#> [1] "Process: 18700 - 260966.8/6652718.0 - dom - 100/1 - path: data/dem"
#> [1] "Load demo file: data/dem/18700_dom_25833_d00100m_1.0m.tif"
#> [1] "Process: 18700 - 260966.8/6652718.0 - dtm - 20000/20 - path: data/dem"
#> [1] "Load demo file: data/dem/18700_dtm_25833_d20000m_20.0m.tif"
#> Over-riding projection check
#> Importing raster map <elev>...
#> 0% 3% 6% 9% 12% 15% 18% 21% 24% 27% 30% 33% 36% 39% 42% 45% 48% 51% 54% 57% 60% 63% 66% 69% 72% 75% 78% 81% 84% 87% 90% 93% 96% 99% 100%
#> SpatRaster read into GRASS using r.in.gdal from memory
#> Over-riding projection check
#> Importing raster map <elev>...
#> 0% 3% 6% 9% 12% 15% 18% 21% 24% 27% 30% 33% 36% 39% 42% 45% 48% 51% 54% 57% 60% 63% 66% 69% 72% 75% 78% 81% 84% 87% 90% 93% 96% 99% 100%
#> SpatRaster read into GRASS using r.in.gdal from memory
#> Over-riding projection check
#> Importing raster map <elev>...
#> 0% 3% 6% 9% 12% 15% 18% 21% 24% 27% 30% 33% 36% 39% 42% 45% 48% 51% 54% 57% 60% 63% 66% 69% 72% 75% 78% 81% 84% 87% 90% 93% 96% 99% 100%
#> SpatRaster read into GRASS using r.in.gdal from memory
# Load a digital elevation model
dem <- download_dem_kartverket(stn, name = "dtm")
#> [1] "Process: 18700 - 260966.8/6652718.0 - dtm - 100/1 - path: data/dem"
#> [1] "Load demo file: data/dem/18700_dtm_25833_d00100m_1.0m.tif"
# Compute class
compute_class_air_temperature(stn,
landtype_dist,
horizon_max,
dem,
test_type = "WMO",
f_plot = TRUE)
 #> [1] " "
#> [1] "-------------------------------------------"
#> class_slope class_vegetation class_landtype class_shade
#> "class1" "class1" "class4" "class5"
#> [1] "-------------------------------------------"
#> [1] "-------------------------------------------"
#> [1] " "
#> [1] " "
#> class_slope class_vegetation class_landtype class_shade
#> "class1" "class1" "class4" "class5"
#> [1] " "
#> [1] "-------------------------------------------"
#> class_slope class_vegetation class_landtype class_shade
#> "class1" "class1" "class4" "class5"
#> [1] "-------------------------------------------"
#> [1] "-------------------------------------------"
#> [1] " "
#> [1] " "
#> class_slope class_vegetation class_landtype class_shade
#> "class1" "class1" "class4" "class5"