Compute distance distribution of landcover types
Source:R/compute_landtype_distance.R
compute_landtype_distance.RdCompute distance distribution of land cover types around a station to assess the WMO siting class
Examples
# Get station metadata
stn <- get_metadata_frost(stationid = 18700, dx = 100, resx = 1, path = NULL)
# Compute land type
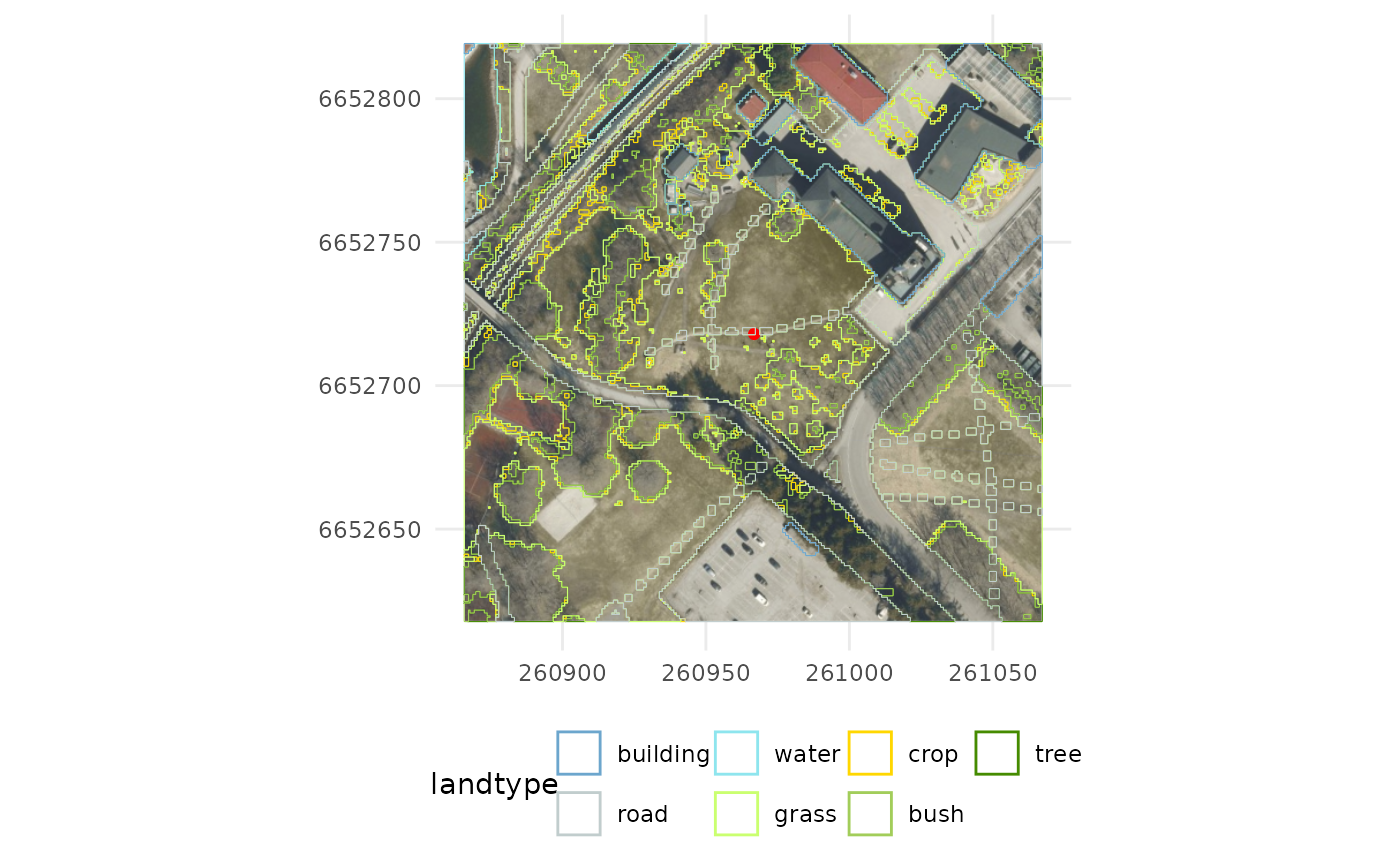
landtype <- compute_landtype(stn, f_plot = TRUE)
#> [1] "Process: 18700 - 260966.8/6652718.0 - dtm - 100/1 - path: data/dem"
#> [1] "Load demo file: data/dem/18700_dtm_25833_d00100m_1.0m.tif"
#> [1] "Process: 18700 - 260966.8/6652718.0 - dom - 100/1 - path: data/dem"
#> [1] "Load demo file: data/dem/18700_dom_25833_d00100m_1.0m.tif"
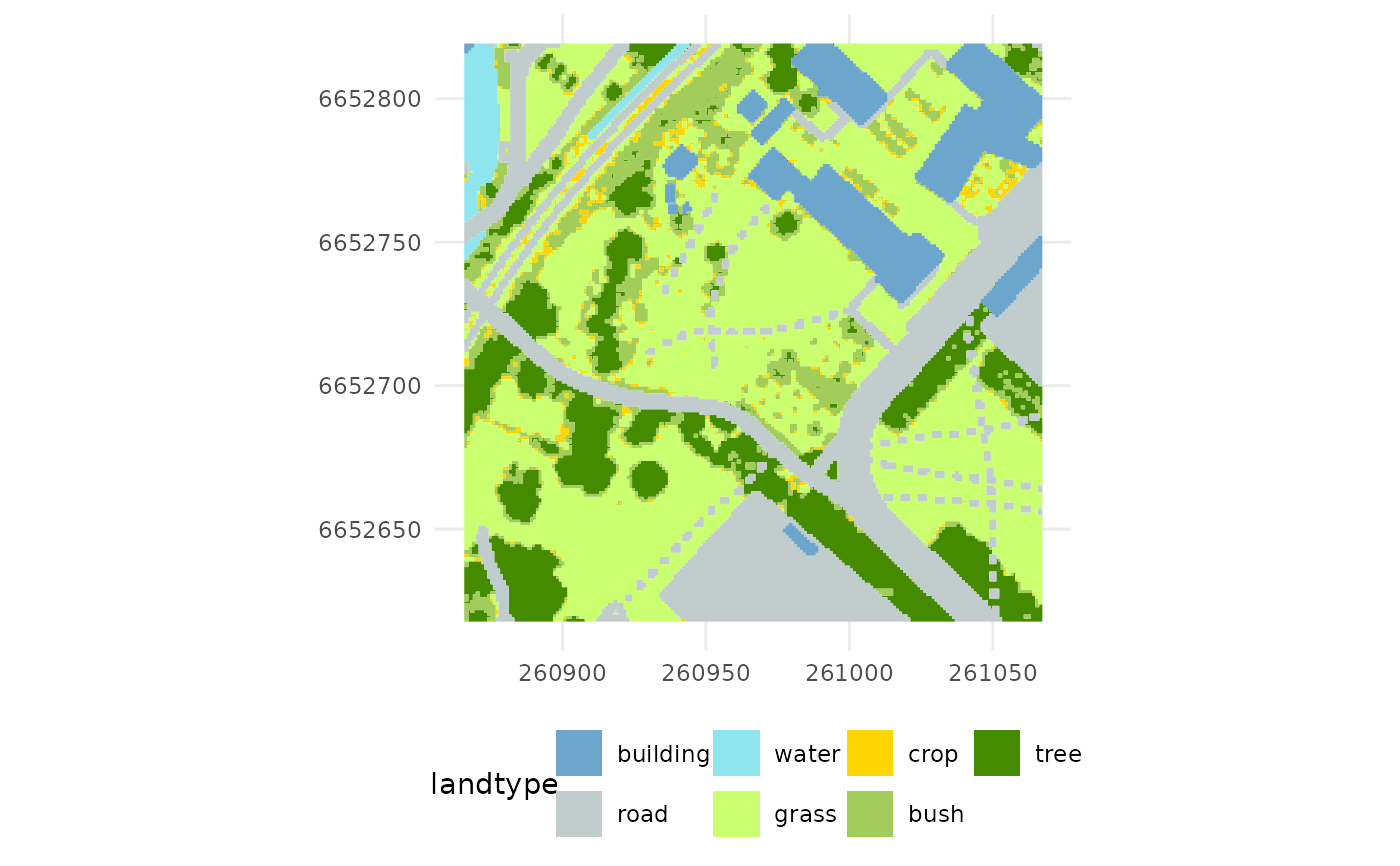 # Compute land type distance to station
landtype_dist <- compute_landtype_distance(stn, landtype, f_plot = TRUE)
#> [1] "Process: 18700 - 260966.8/6652718.0 - dtm - 100/1 - path: data/dem"
#> [1] "Load demo file: data/dem/18700_dtm_25833_d00100m_1.0m.tif"
# Compute land type distance to station
landtype_dist <- compute_landtype_distance(stn, landtype, f_plot = TRUE)
#> [1] "Process: 18700 - 260966.8/6652718.0 - dtm - 100/1 - path: data/dem"
#> [1] "Load demo file: data/dem/18700_dtm_25833_d00100m_1.0m.tif"