Plots publicly-available maps, atlas, land cover or satellite imagery near
a weather station based on maptiles and custom-made "get_tile_wms"
Arguments
- stn
A SpatVector with station attributes from
"get_latlon_frost"- box
A SpatExtent defining the area to plot
- tile_name
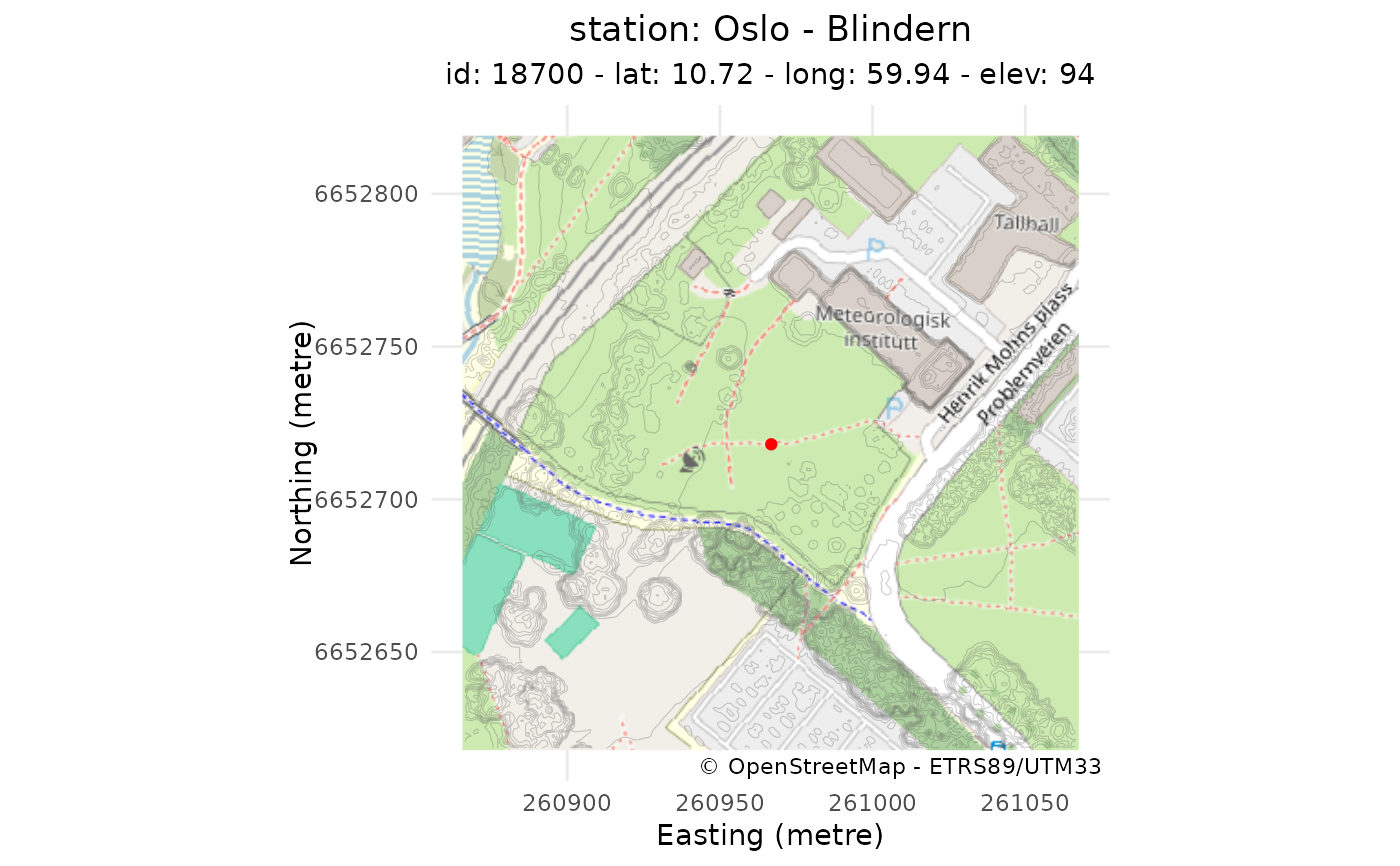
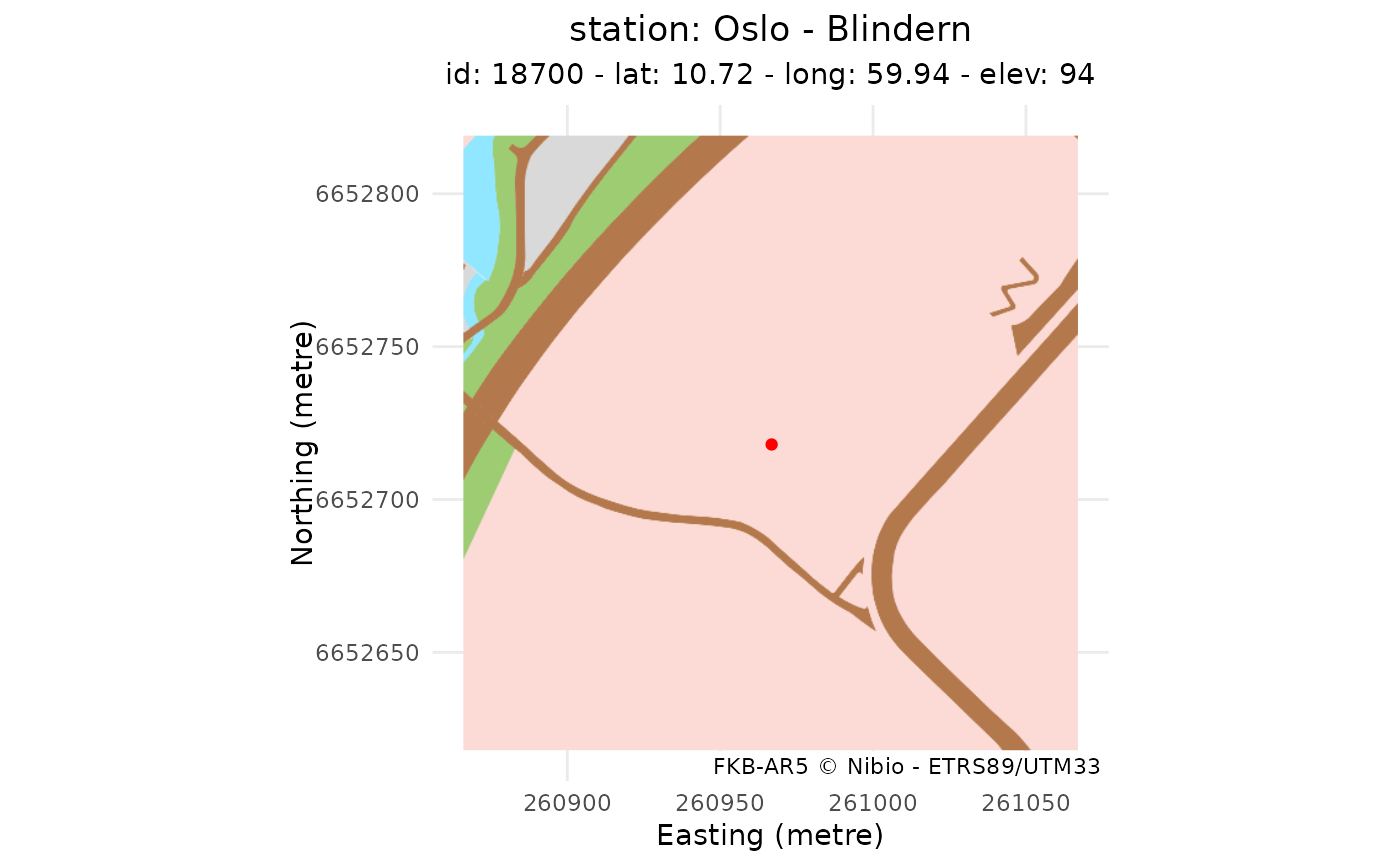
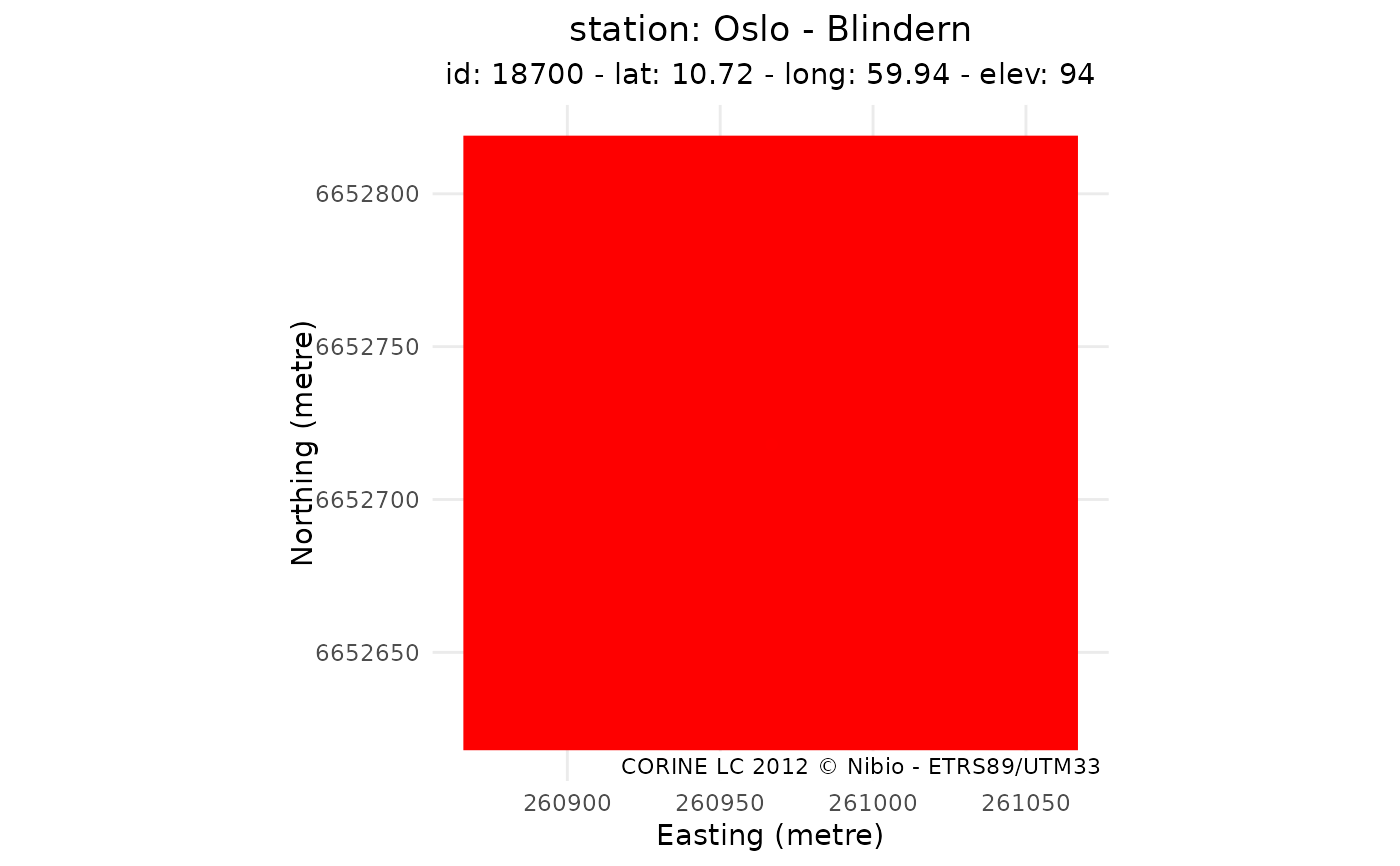
A string defining the type of tile to plot among "osm" (map, default), "esri" (satellite imagery), "ar5" (area type), "clc" (Corine land cover) and "urban" (urban atlas)
- dsm
A SpatRaster of a digital surface model around the station, expected radius is 100 m
- path
A string path that defines where to save the plot, if NULL (default) the plot is printed on-screen and not saved
Examples
# Get station coordinates and name
stn <- get_metadata_frost(stationid = 18700, dx = 100, resx = 1)
# Construct box to extract WMS tile
box <- make_bbox(stn)
# Plot maps using plot_tile_station()
g <- plot_tile_station(stn, box, tile_name = "esri")
g
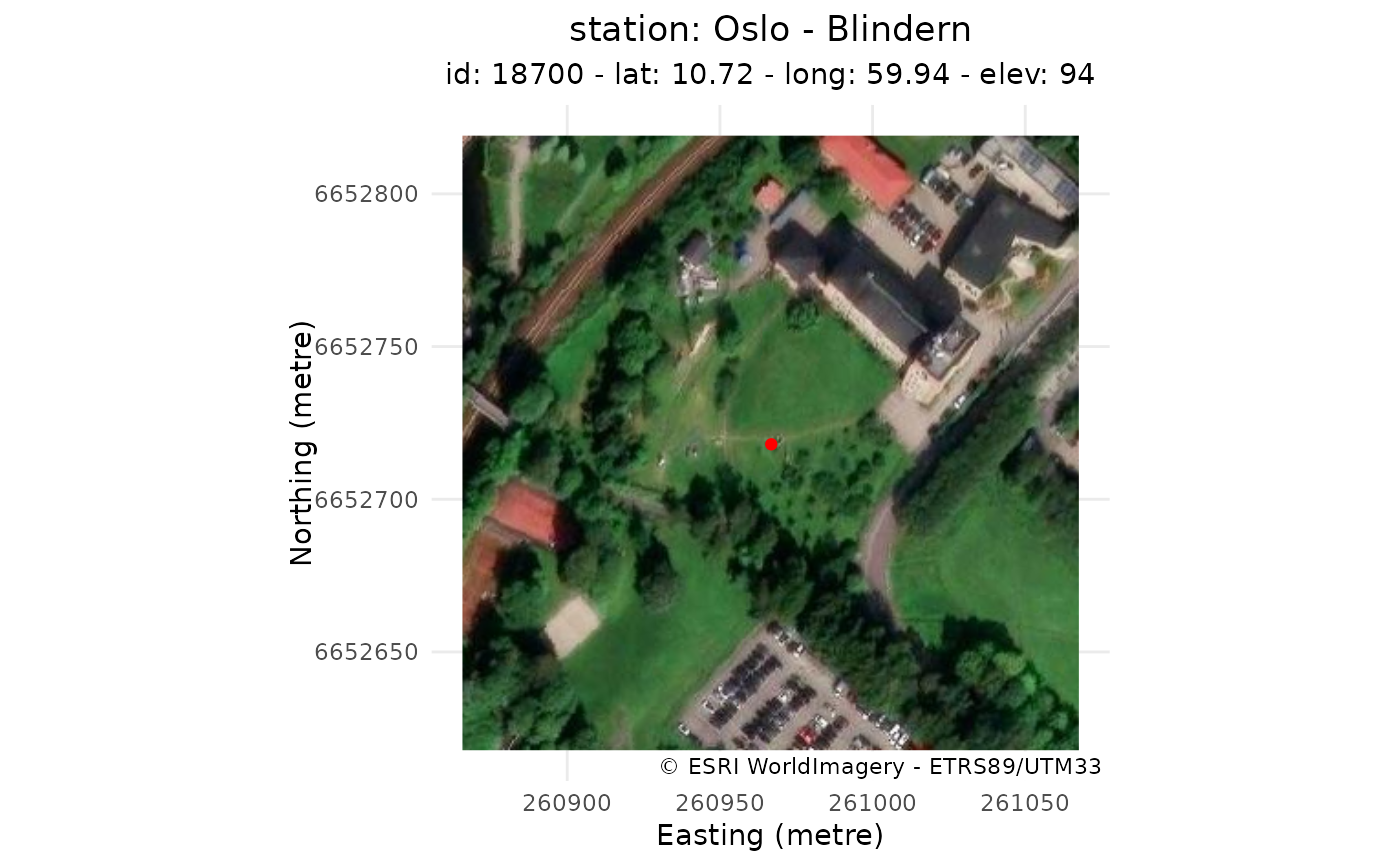 plot_tile_station(stn, box, tile_name = "esri")
 plot_tile_station(stn, box, tile_name = "ar5")
 plot_tile_station(stn, box, tile_name = "clc")
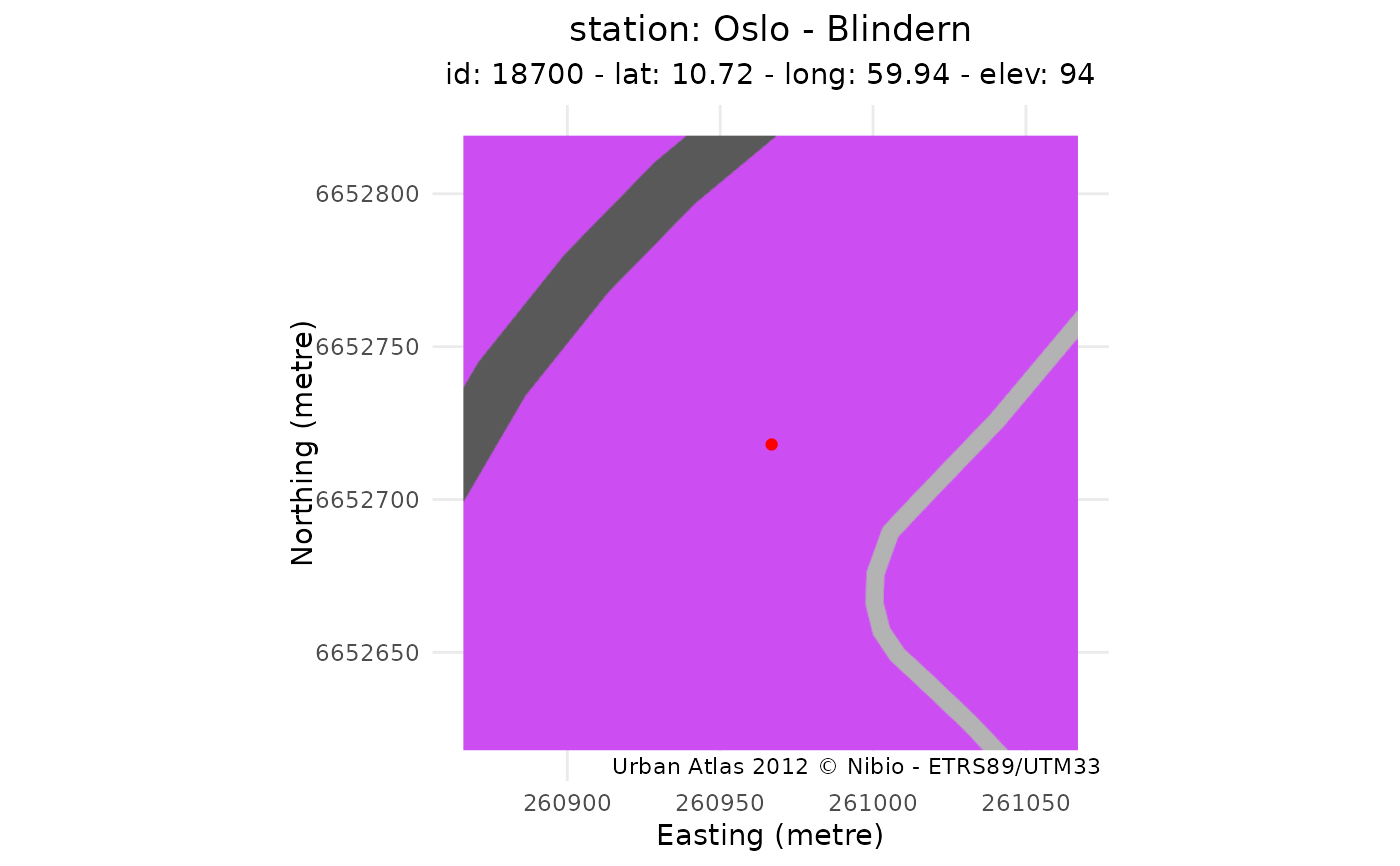
 plot_tile_station(stn, box, tile_name = "urban")
 # Include Digital Elevation Model as contour
dsm <- download_dem_kartverket(stn, name = "dom")
#> [1] "Process: 18700 - 260966.8/6652718.0 - dom - 100/1 - path: data/dem"
#> [1] "Load demo file: data/dem/18700_dom_25833_d00100m_1.0m.tif"
plot_tile_station(stn, box, tile_name = "osm", dsm = dsm, path = "plot/map")
# Include Digital Elevation Model as contour
dsm <- download_dem_kartverket(stn, name = "dom")
#> [1] "Process: 18700 - 260966.8/6652718.0 - dom - 100/1 - path: data/dem"
#> [1] "Load demo file: data/dem/18700_dom_25833_d00100m_1.0m.tif"
plot_tile_station(stn, box, tile_name = "osm", dsm = dsm, path = "plot/map")