Plot horizon with sun positions for a given station location
Source:R/plot_station_horizon_sun.R
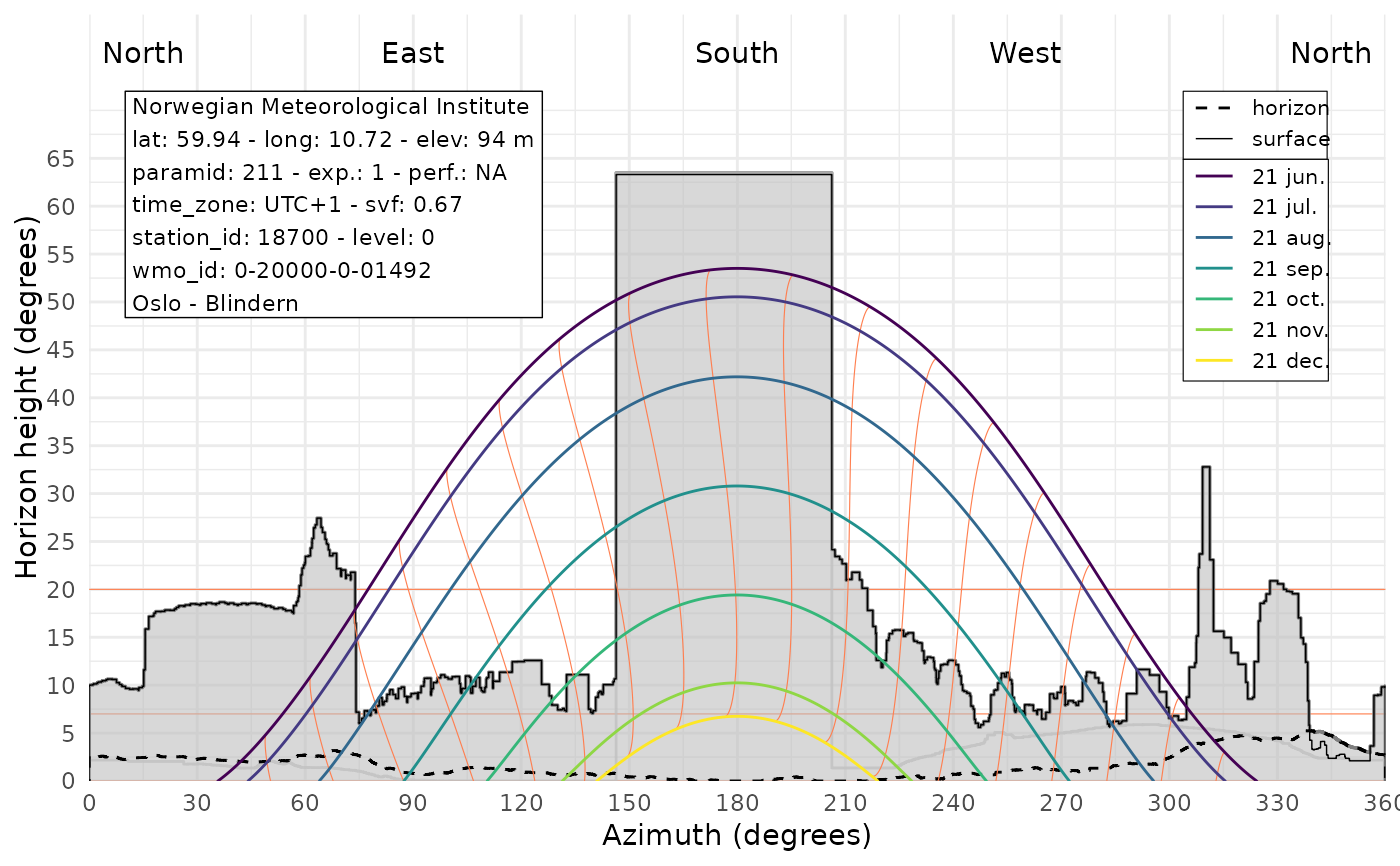
plot_station_horizon_sun.RdPlot sun position and horizons from local terrain model, local surface model and regional digital terrain model with infos from the weather station.
Examples
# Load the station metadata and location
stn <- get_metadata_frost(stationid = 18700)

# Plot sun diagram and save
plot_station_horizon_sun(stn, path  = "plot/horizon")
#> [1] "Process: 18700 - 260966.8/6652718.0 - dtm - 100/1 - path: data/dem"
#> [1] "Load demo file: data/dem/18700_dtm_25833_d00100m_1.0m.tif"
#> [1] "Process: 18700 - 260966.8/6652718.0 - dom - 100/1 - path: data/dem"
#> [1] "Load demo file: data/dem/18700_dom_25833_d00100m_1.0m.tif"
#> [1] "Process: 18700 - 260966.8/6652718.0 - dtm - 20000/20 - path: data/dem"
#> [1] "Load demo file: data/dem/18700_dtm_25833_d20000m_20.0m.tif"
#> Over-riding projection check
#> Importing raster map <elev>...
#>    0%   3%   6%   9%  12%  15%  18%  21%  24%  27%  30%  33%  36%  39%  42%  45%  48%  51%  54%  57%  60%  63%  66%  69%  72%  75%  78%  81%  84%  87%  90%  93%  96%  99% 100%
#> SpatRaster read into GRASS using r.in.gdal from memory